Trending
When simulating a facility, it is often interesting to monitor how the actual measurements in the field and the simulated variables behave over time. Therefore, the Simulation package includes a power trend component. Trends can be brought up from many places in the Simulation Dashboard by pressing on a "Show Trend" link.
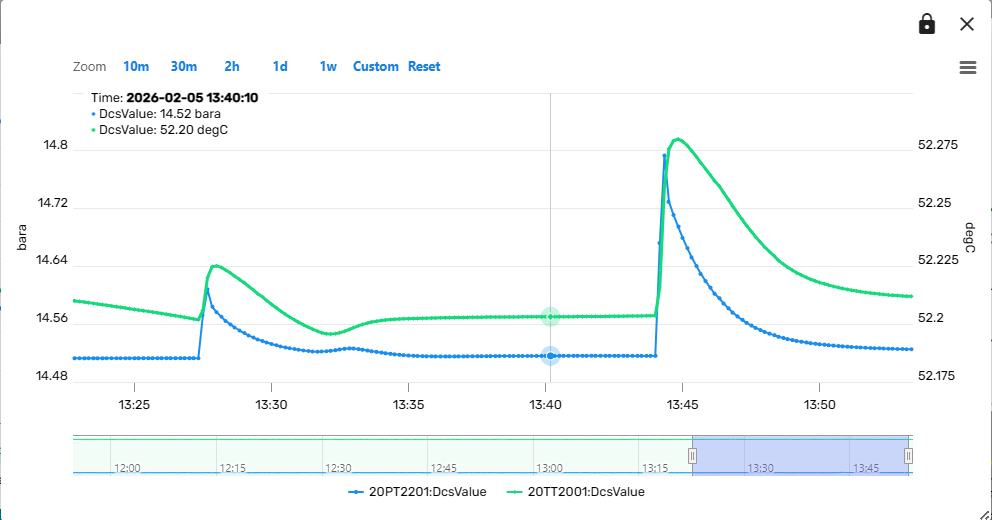
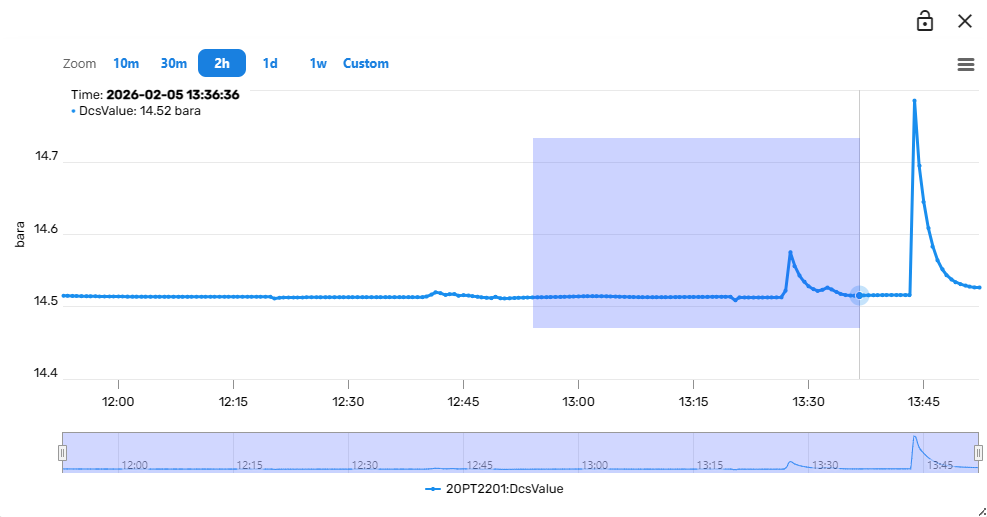
The trend component contains controls to vary the observed time frame and to add other variables to the same trend plot.
When hovering over the trend-lines, the variable values at that specific point in time are displayed in a hovering overlay in the upper region of the trend component.
Change Observed Time Frame
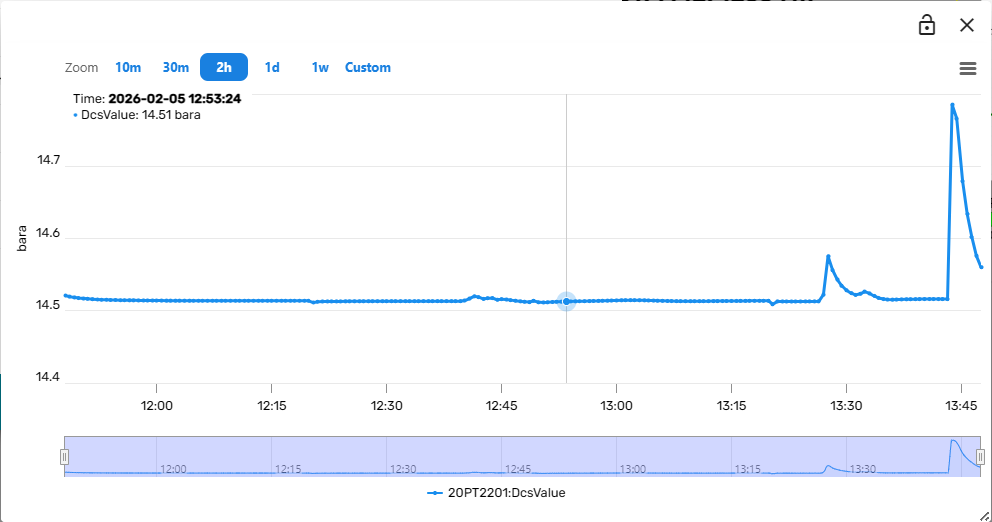
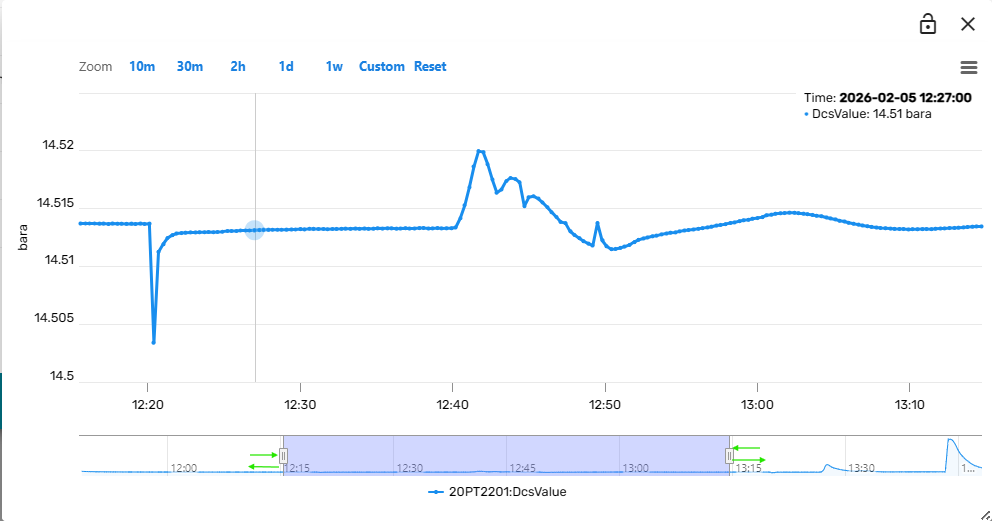
There are multiple ways to change the time period that is being displayed in the trend plot. The first option is to drag the sliders in the miniature time-axis in the lower area of the trend component left or right. The entire observation window (translucent blue rectangle) can be moved back and forth in time by holding the left mouse button clicked and dragging the window left or right.
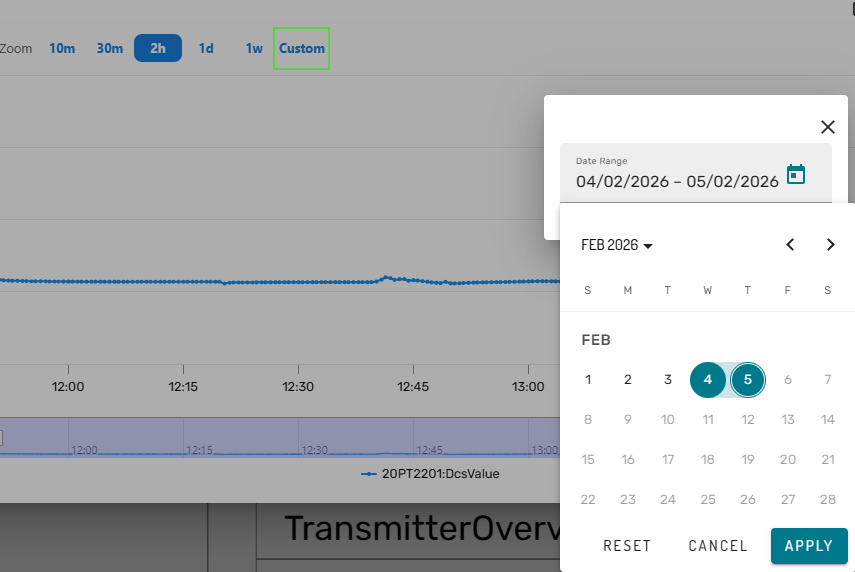
Alternatively, the user can pick one of the default options in the top of the trend component (e.g. past 10 minutes), or select a custom date range:
Additionally, it is at any time possible to zoom into the trend by dragging a rectangle within the actual trend plot:
The trend component will then zoom into the selected time-period and Y-Axis section.
Add additional variables to a Trend
In many cases it will be useful to compare the trends of multiple variables within the same plot. This can be achieved by clicking on the lock symbol in the upper right corner of the trend component. Subsequently, clicking on a "Show Trend" link from the Simulation dashboard (for example from a Module Faceplate) will then add the variable to the existing trend instead of opening a new trend component. In this way, composite trends of multiple variables can be constructed interactively.