Simulation Dashboard Overview
The Simulation dashboard is the main visualization component for integrated Simulations. It contains a rich set of functionality.
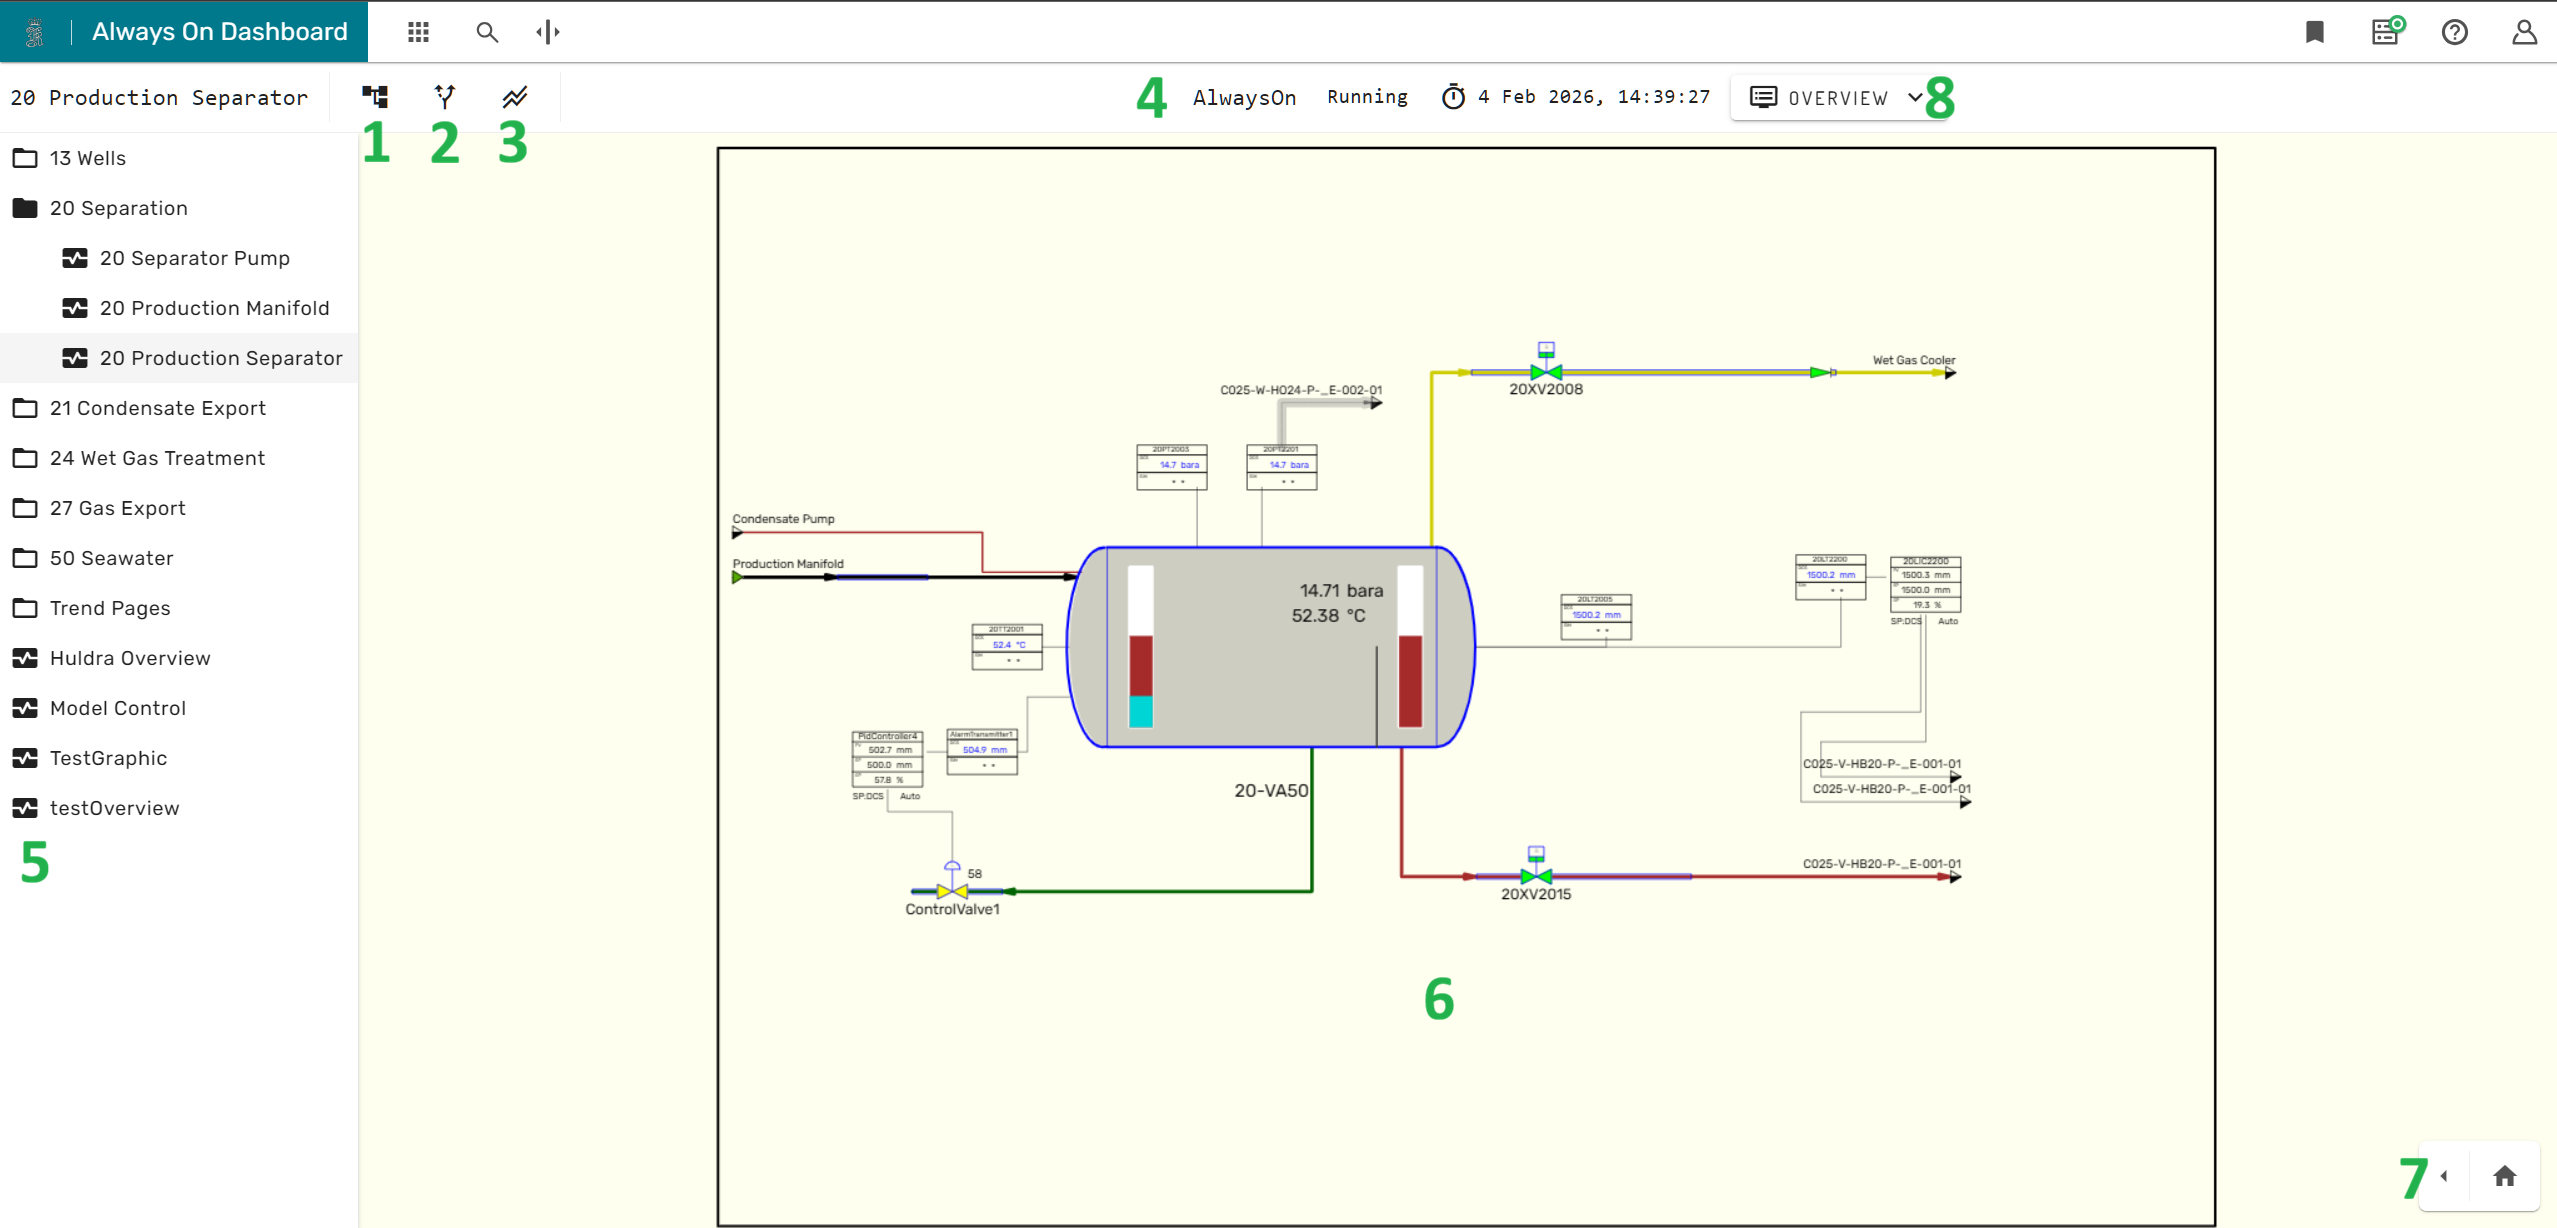
The tree structure icon 1 in the main menu bar shows or hides the process graphic navigation menu 5 on the left side of the screen.
The branching arrows icon 2 opens the What-If Simulation Panel.
The two parallel trend lines icon 3 opens the buffered trends menu.
In the central area of the main menu bar 4 provides status information about the simulation, as for example the running state, the current model time.
In the center of the simulation dashboard, the currently selected simulation graphic 6 is displayed.
In the lower right corner 7, the layer menu and the Unit Profiles can be expanded.
To the right of the main menu bar 8, the module overview menus can be accessed.
Simulation Graphics
Simulation graphics are generated in dedicated desktop software and can be uploaded to Kognitwin through the admin portal.
Simulation graphics can contain the following elements: - A frame with a background - Static text and dynamically updating text fields - Equipment symbols, representing physical or virtual equipment like pumps, valves, compressors and sensors - Connection lines, represent one of the following: - Pipes carrying process fluid (colored lines, color indicates the fluid type) - Cables conducting electricity (black lines) - Mechanical shafts, conveying kinetic energy (black lines) - Low-Voltage Cables conducting signals, e.g. measurement values or control signals (dashed black lines) - Logical states as ON/OFF, TRUE/FALSE (black lines that turn red/green based on the signal)
Equipment symbols provide both left-click interaction (open the module faceplate) and right-click interaction (open the Kognitwin context-menu). Many equipment symbols will also change their appearance based on the state of the equipment they are representing. Valves will for example be green in open position, grey in closed position and yellow in a partially open position.
Connection lines provide left-click interaction (open the stream dialog).
Navigating Simulation Graphics
The simulation dashboard provides the following ways to navigate between simulation graphics:
- The Simulation Graphic Navigator menu
- Stream Connectors
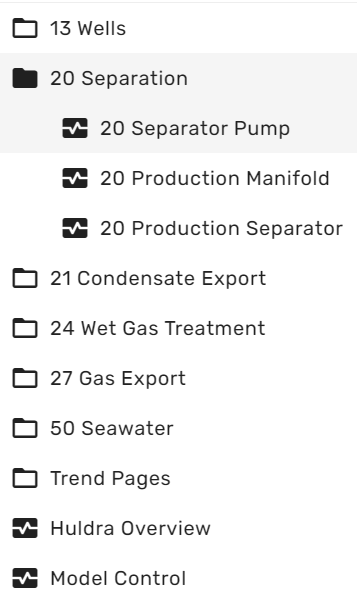
The Simulation Graphic Navigator can be expanded on the left side of the screen as described in the overview section. The simulation graphic navigator uses a tree like structure, branches can be expanded and deflated by clicking on the folder icon. The actual simulation graphics are represented by a small rectangle with a wave function plot. Left-clicking on a graphic icon will open the graphic in the main area of the simulation dashboard.
If connection lines connect signals or process fluid streams across multiple graphics, the two corresponding ends are connected through so called "stream connectors", which typically look like small triangles (arrow tips).
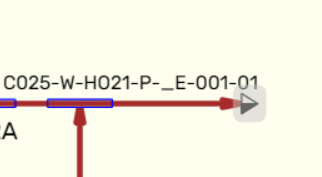
By left-clicking on a stream connector the connecting simulation graphic is opened in the main area of the simulation dashboard.
Module Faceplate
Equipment Symbols (e.g. pumps, transmitters, valves etc.) have dedicated, module specific faceplates.
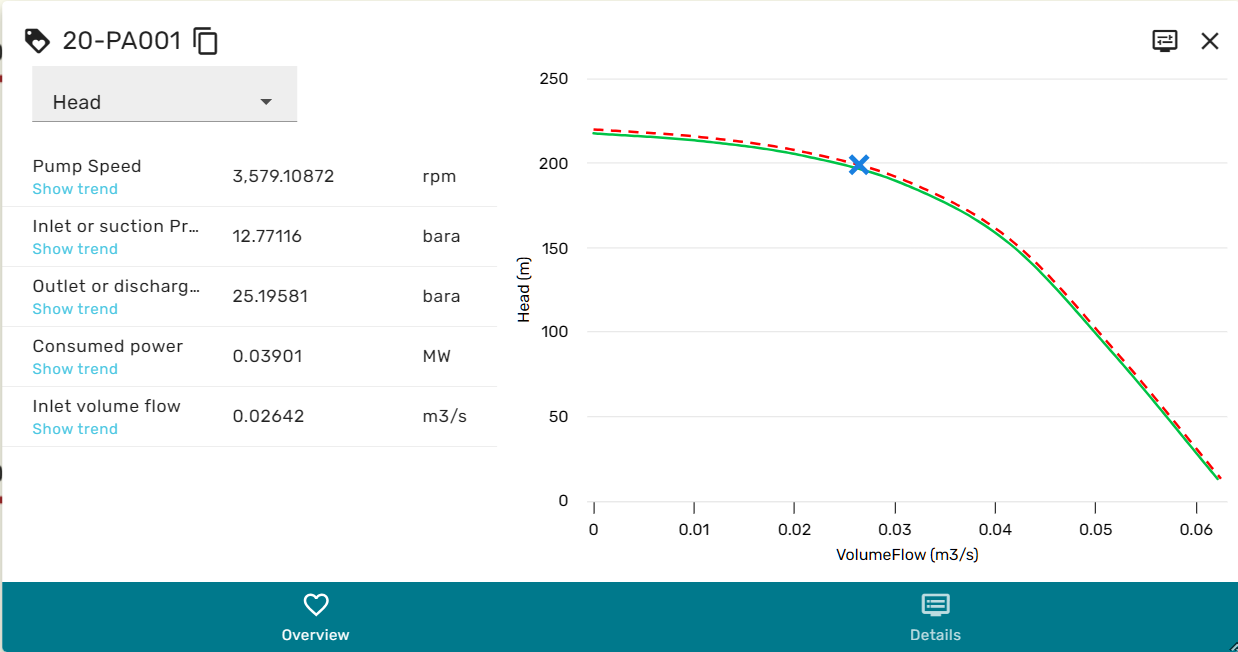 Facplates are generally build up from two main areas, the left area containing the most important variables and their current value, and the right area, that can depict a relevant trend or performance map for the specific equipment.
Some module faceplates also contain a drop-down menu at the top, which allows swapping out the plot or performance map in the right area.
The blue hyperlinks below the variables in the left area allow bringing up a trend for the corresponding variable. Sometimes, variables can have complex data-types that cannot be displayed as a number or text. In these cases, the variable value will become a hyper-link which opens a variable viewer on left-click.
Module Explorer
The Module explorer can be accessed in the following ways:
- From the icon in the upper right corner of module faceplates
- From the right click context menu
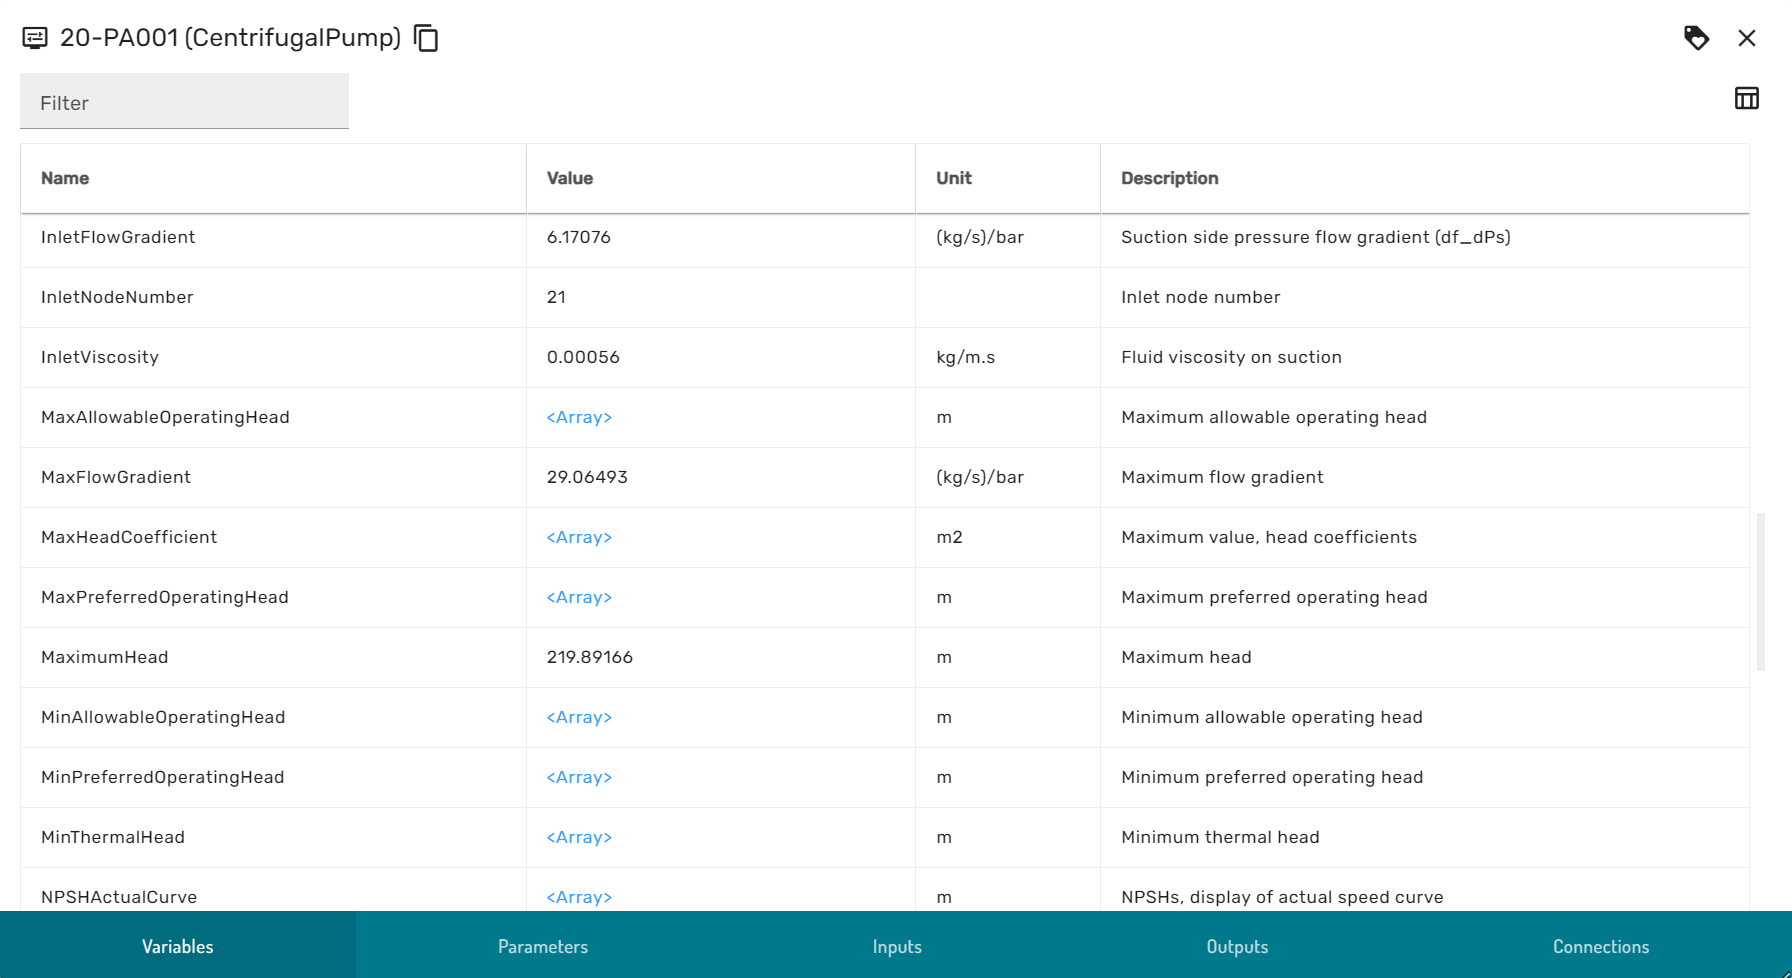
The module explorer is comprised of the following views, that can be swapped through the ribbon menu at the bottom of the dialog:
- Variables: Contains variables that are used internally by the simulator
- Parameters: Contains variables that define the physical and logical properties of equipment, for example design parameters or signal behavior rules
- Inputs: The variables that serve as the input to every simulation calculation step, for example process streams, boundary conditions and signal inputs
- Outputs: The variables that are calculated at every simulation calculation step, the results of the simulation.
- Browse Connections, further described in the browse connection dialog section
Stream Dialog
The Stream dialog is comprised of a left and a right area, and has an overview and a details view.
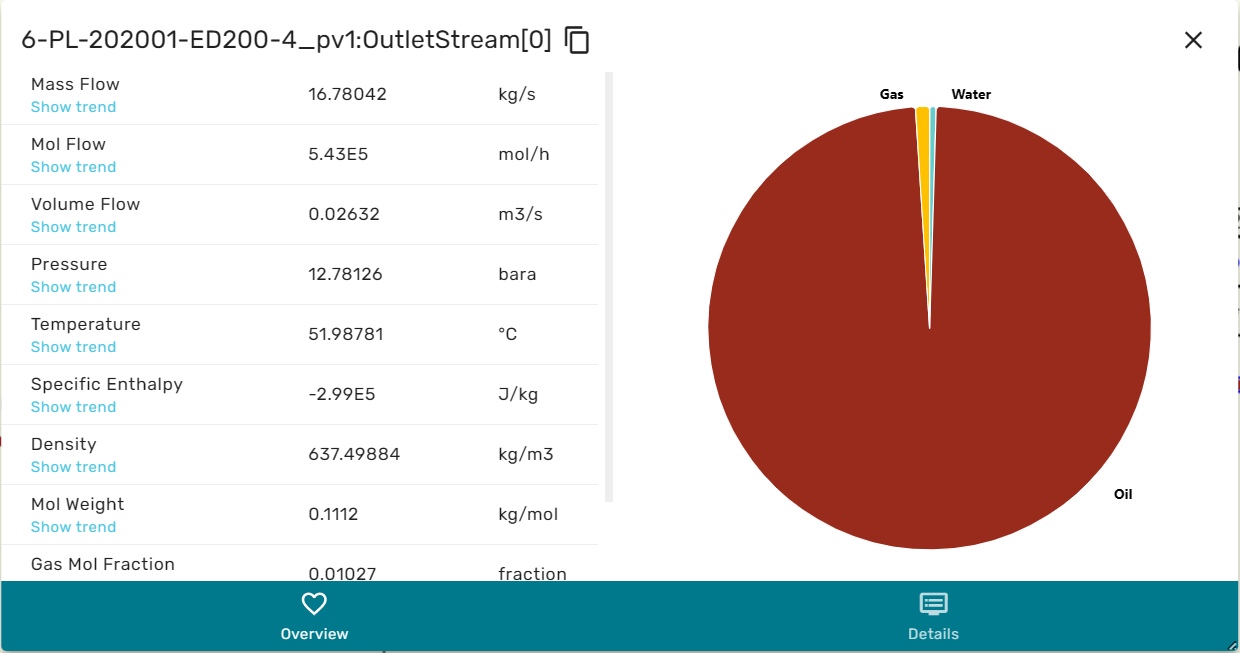
When in overview, the he left area contains a selection of the intensive and extensive thermodynamic properties of the stream, as for example massflowrate, temperature, enthalpy etc. The right area contains a cake diagram of the fluid phases (e.g. oil, gas water). By hovering the mouse over the cake diagram the numerical values for the phase fractions are displayed.
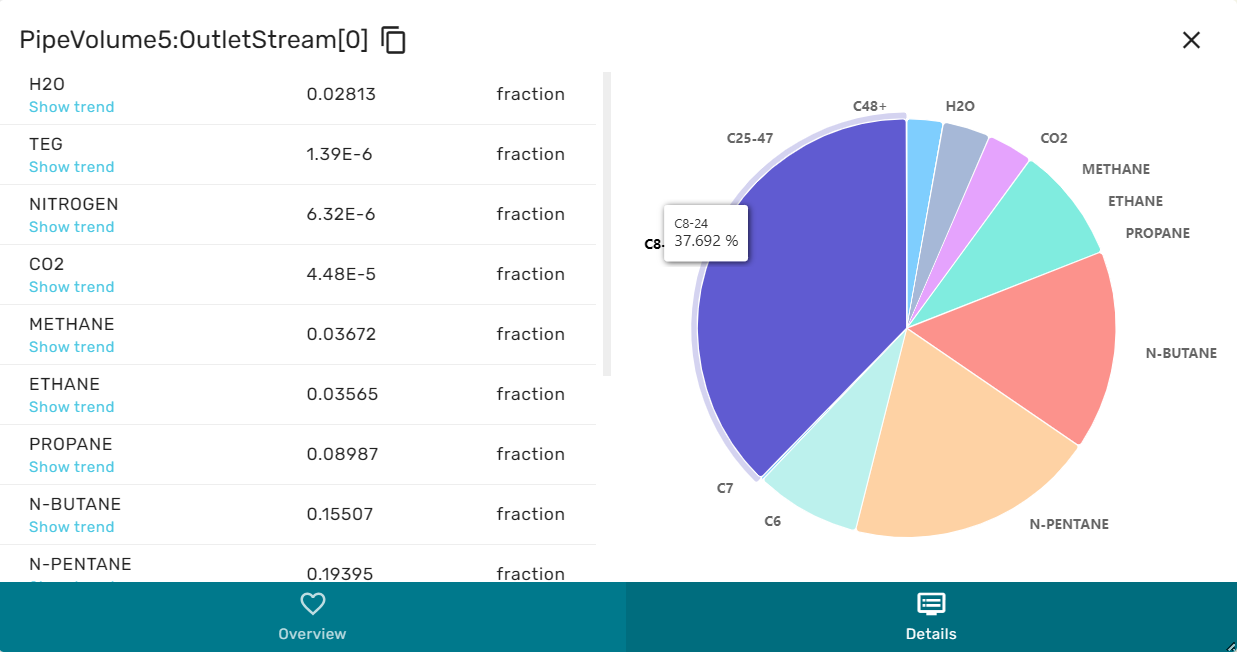
When in Details view, the left area shows a list of all chemical species that are contained in the stream and their concentrations. The right area then shows a cake diagram of the chemical composition. By hovering the mouse over the cake diagram the exact numerical values for molar concentrations are displayed.
Browse Connection Dialog
The browse connection dialog allows users to explore the semantic topology of the simulation model. It shows all incoming and outgoing topological connections to and from a specific simulation module, and which variable they are connected to.
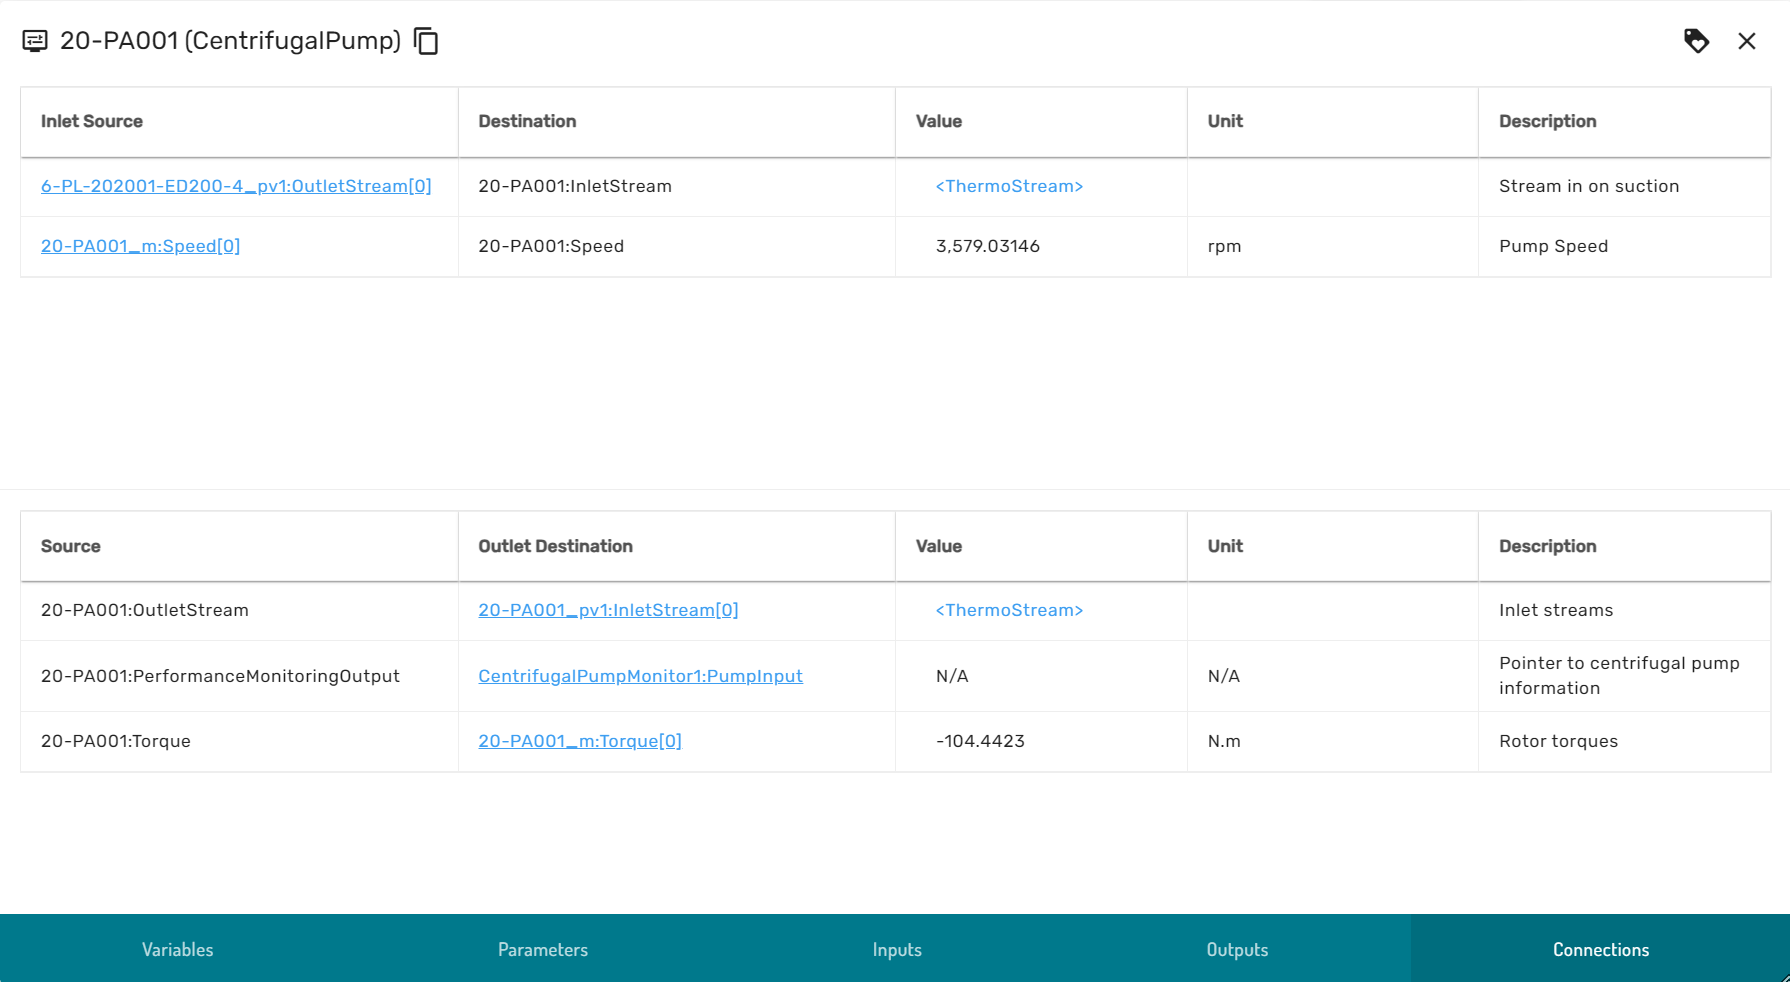
By clicking on the blue hyperlinks, the browse connection dialog traverses along the model topology graph to the adjacent incoming upstream module or subsequent downstream module. If a connection is of a primitive type (numeric, boolean or enumerator) the value of the connected variable is displayed, otherwise a hyperlink to the variable viewer is provided.
Buffered Trends
Simulations contain many variables and not all variables can be stored in the time-series database. Therefore, short-term time-series can be buffered in a browser session. When opening a trend for a variable that is not recorded in the time-series database, Kognitwin Simulation automatically adds the variable to the buffered trend variables.
The buffered trends overview menu gives a list of all buffered variables, as well as the possibility to extract a list with these variables, so that it can be restored at a later point in time or for a similar simulation (Import).
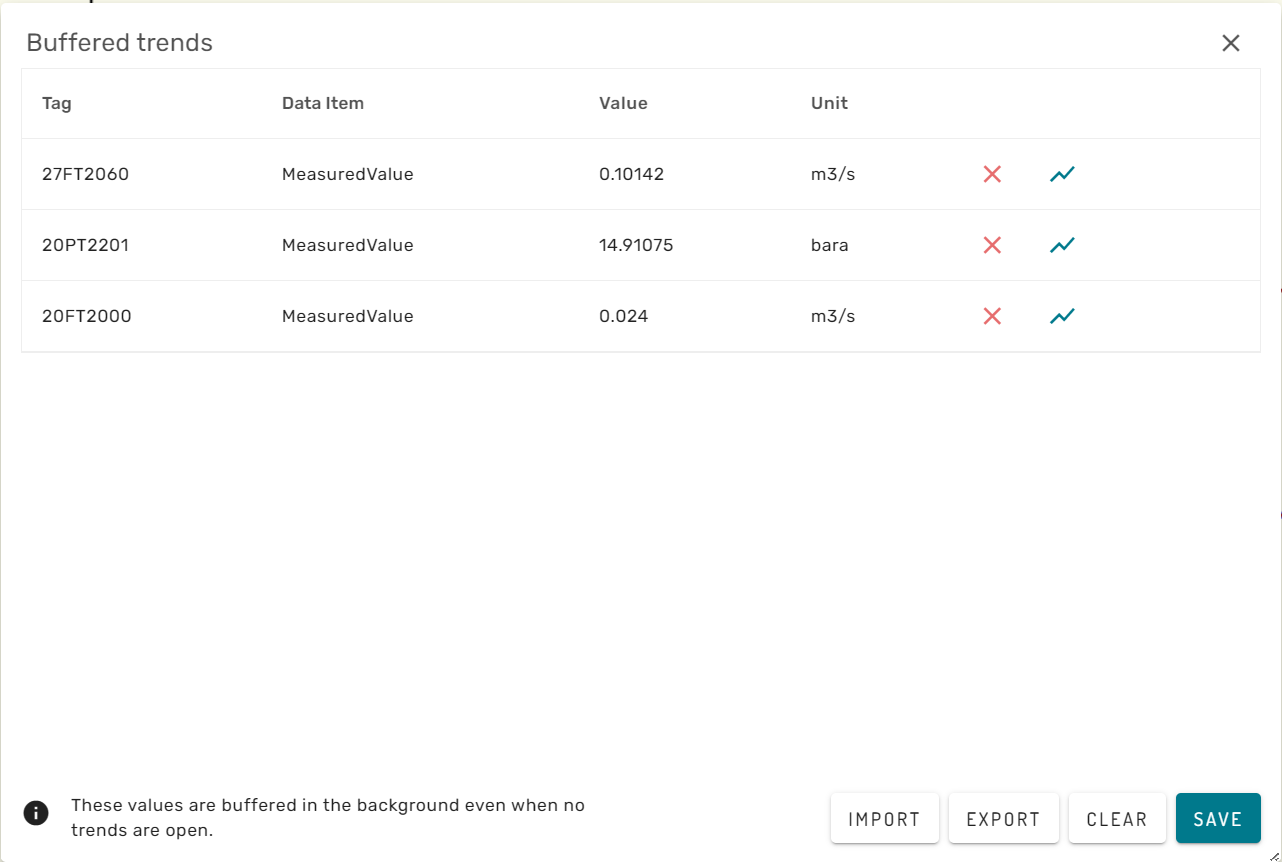
The red cross-mark behind a buffered variable will remove it from the browser caching. The blue trend icon will open the buffered trend for the specific variable.
The clear button removes all buffered variables from the browser session and clears the list.
Layer Menu
The Layer Menu allows to show and hide different graphical features in the simulation graphic main view.
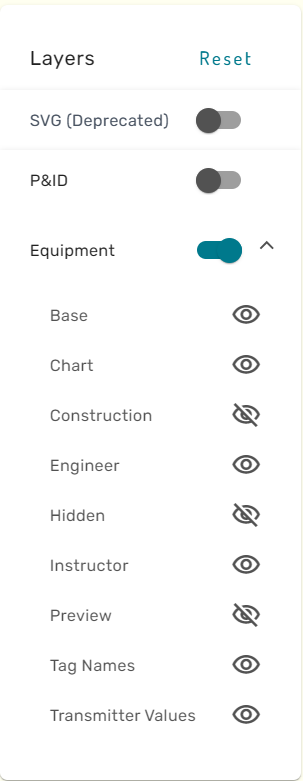
By clicking on the eye-icon, the respective layer can be shown or hidden. For certain graphics, a special "P&ID" layer is available. This layer contains the Process and Instrumentation Diagram that the simulation graphic has been built from.
Model Overview Menus
Depending on the model content, different overview menus for specific module types (e.g. PID controllers, Replacers) are be available.
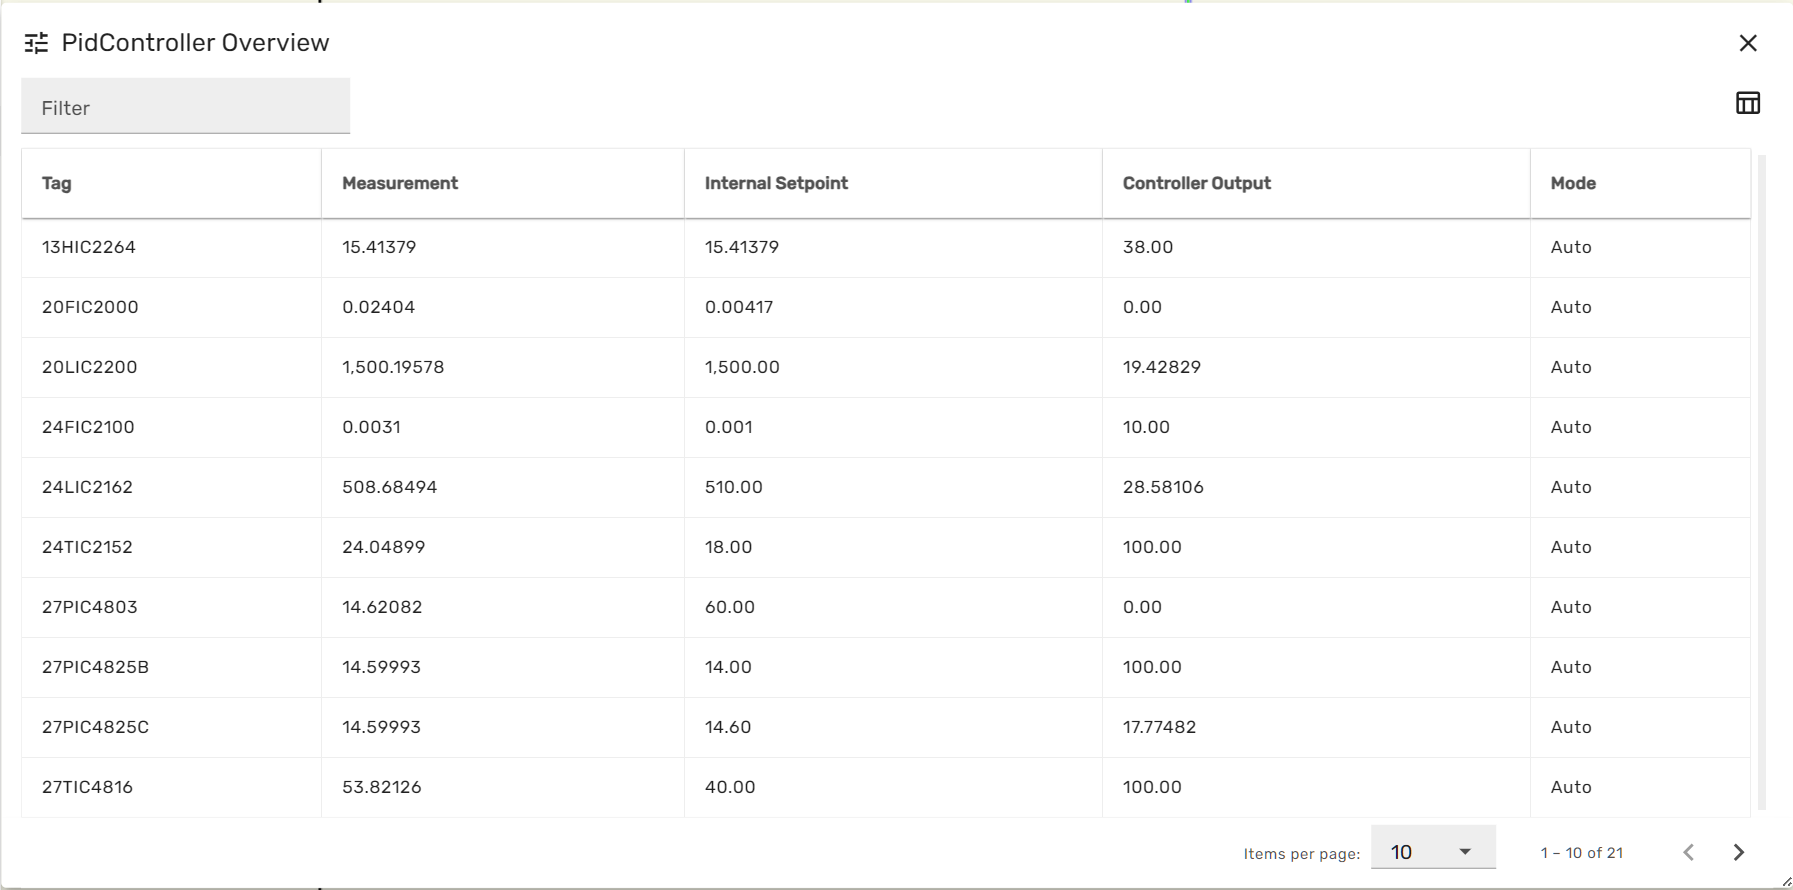
Each module overview menus list all modules of a specific type across the entire simulation model, together with some of the most important variables for this module type. The grey filter box in the upper left corner allows to enter a string, which will be applied as a filter on the module names. Thereby the list can be limited to selected entries.
When clicking on a row of the module overview table, the module-faceplate for the respective module opens.
Kognitwin Context Menu
When right-clicking on a simulation module symbol, the Kogntiwin Context menu opens.
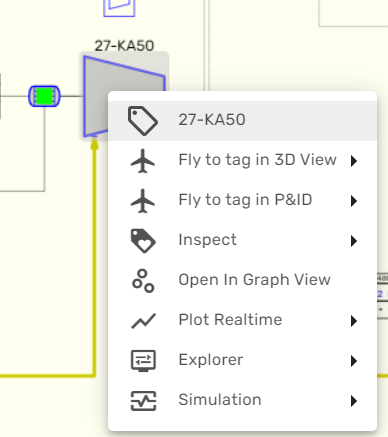
From here, the generic Kognitwin Tag explorer and all contextualized data for the simulated equipment can be accessed. Several entries allow to launch alternative workflows, as for example 3D visualization, the document viewer or the Kognitwin Graph View. From here, also the Module Explorer and all other Simulation graphics that contain the same module are available.